limix.plot.qqplot
-
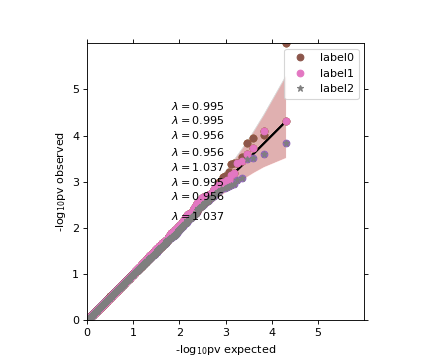
limix.plot.qqplot(a, label=None, alpha=0.05, cutoff=0.1, line=True, pts_kws=None, band_kws=None, ax=None, show_lambda=True)¶ Quantile-Quantile plot of observed p-values versus theoretical ones.
Parameters: - a (Series, 1d-array, list) – Observed p-values.
- label (string, optional) – Legend label for the relevent component of the plot.
- alpha (float, optional) – Significance level defining the confidfence interval. Set to
Noneto disable plotting. Defaults to0.05. - cutoff (float, optional) – P-values higher than cutoff will not be plotted. Defaults to
0.1. - line (bool, optional) – Whether or not plot a straight line. Defaults to
True. - pts_kws (dict, optional) – Keyword arguments forwarded to the matplotlib function used for plotting the points.
- band_kws (dict, optional) – Keyword arguments forwarded to the fill_between function used for plotting the confidence band.
- ax (matplotlib Axes, optional) – The target handle for this figure. If
None, the current axes is set.
Returns: ax – Axes object with the plot for further tweaking.
Return type: matplotlib Axes
Examples
(Source code, png)