limix.plot.kinship
-
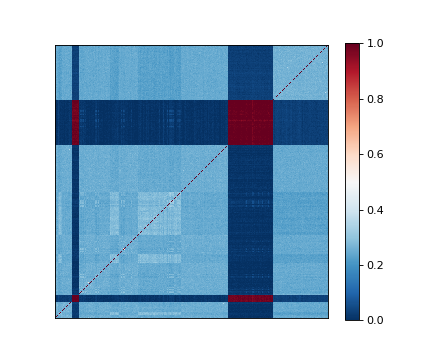
limix.plot.kinship(K, nclusters=1, img_kws=None, ax=None)¶ Plot heatmap of a kinship matrix.
Parameters: - K (2d-array) – Kinship matrix.
- nclusters (int, str, optional) – Number of blocks to be seen from the heatmap. It defaults to
1, which means that no ordering is performed. Pass"auto"to automatically determine the number of clusters. Pass an integer to select the number of clusters. - img_kws (dict, optional) – Keyword arguments forwarded to the matplotlib pcolormesh function.
- ax (matplotlib Axes, optional) – The target handle for this figure. If
None, the current axes is set.
Returns: ax – Axes object with the plot for further tweaking.
Return type: matplotlib Axes
Examples
(Source code, png)