limix.plot.normal

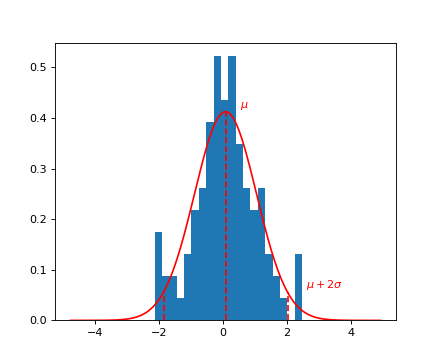
limix.plot.normal(x, bins=20, nstd=2, ax=None)

Plot a fit of a normal distribution to the data in x.

Parameters:
  • x (array_like) – Values to be fitted.
  • bins (int, optional) – Number of histogram bins. Defaults to 20.
  • nstd (float, optional) – Standard deviation multiplier for drawing a dashed line.
  • ax (matplotlib Axes, optional) – The target handle for this figure. If None, the current axes is set.
Returns:

ax – Axes object with the plot for further tweaking.

Return type:

matplotlib Axes

Examples

(Source code, png)

../_images/limix-plot-normal-1.png