limix.plot.ConsensusCurve
-
class
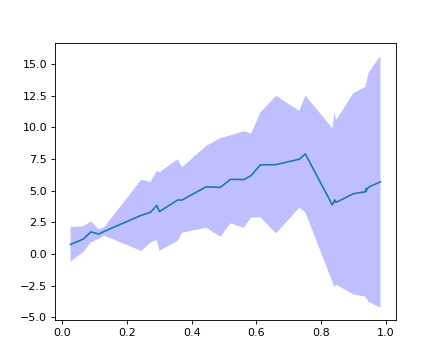
limix.plot.ConsensusCurve¶ Consolidate multiple curves in a single one.
Examples
(Source code, png)
-
__init__()¶ Initialize self. See help(type(self)) for accurate signature.
Methods
__init__()Initialize self. add(x, y)Add a new curve. consensus([std_dev])Return a consensus curve. -
add(x, y)¶ Add a new curve.
Parameters: - x (array_like) – x-coordinate values.
- y (array_like) – y-coordinate values.
-
consensus(std_dev=3.0)¶ Return a consensus curve.
Parameters: std_dev (float) – Confidence band width. Defaults to 3.Returns: - x (array_like) – x-coordinate values.
- ybottom (array_like) – y-coordinate values of the lower part of the confidence band.
- y (array_like) – y-coordinate values of the mean of the confidence band.
- ytop (array_like) – y-coordinate values of the upper part of the confidence band.
-