limix.plot.power
-
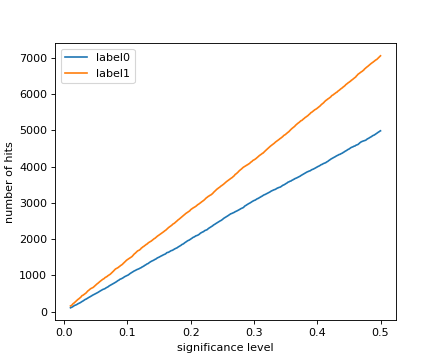
limix.plot.power(pv, label=None, alphas=None, pts_kws=None, ax=None)¶ Plot number of hits across significance levels.
Parameters: - pv (array_like) – P-values.
- label (string, optional) – Legend label for the relevent component of the plot.
- alphas (array_like, optional) – Significance thresholds for which the number of hits is defined.
Defaults to
numpy.linspace(0.01, 0.5, 500). - pts_kws (dict, optional) – Keyword arguments forwarded to the matplotlib function used for plotting the points.
- ax (matplotlib Axes, optional) – The target handle for this figure. If
None, the current axes is set.
Returns: ax – Axes object with the plot for further tweaking.
Return type: matplotlib Axes
Examples
(Source code, png)